Feb 22, 2013
Feb 19, 2013
Bernanke's Kryptonite
by Eric Parnell
How do you stop a man from printing another $1 trillion of
the global reserve currency? This is seemingly an impossible task to
achieve. With inflationary pressures still subdued, the U.S. Federal
Reserve remains compelled to act as aggressively as possible in an
ongoing effort to jump-start the economy and bring down stubbornly high
unemployment. Never mind that the $2.3 trillion already
printed by the Fed since the outbreak of the financial crisis several
years ago has not resulted in a sustainably strong economic recovery to
this point. Perhaps another $1 trillion or more will finally do the
trick. But what are the unintended consequences to these repeated and
extreme actions? And what if anything can finally grab the attention of
the Fed to put a stop to the money printing? Oil may ultimately prove to
be the kryptonite that finally weakens the resolve of Chairman Bernanke
and the Fed's printing press.
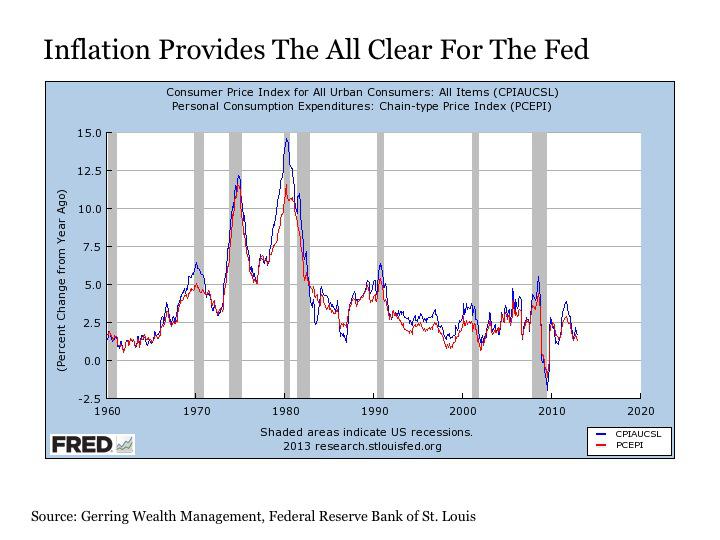
Is Inflation Really Under Control?
This
is an important question to consider before going any further. At first
glance, it appears that inflationary pressures are benign. Two
well-known and widely used measures of inflation illustrate this point.
These are the U.S. Consumer Price Index (CPI) reported by the Bureau of Labor Statistics (BLS)
and the Personal Consumption Expenditure (PCE) price index compiled by
the Bureau of Economic Analysis (BEA). Both are derived using
statistical methodologies in an effort to best estimate changes in the
price level of consumer goods and services over time. And an examination
of both of these measures strongly suggests that inflationary pressures
are under control and pricing stability reigns, with the year over year
change in prices for both measures both comfortably between 1% and 2%.
(click to enlarge)
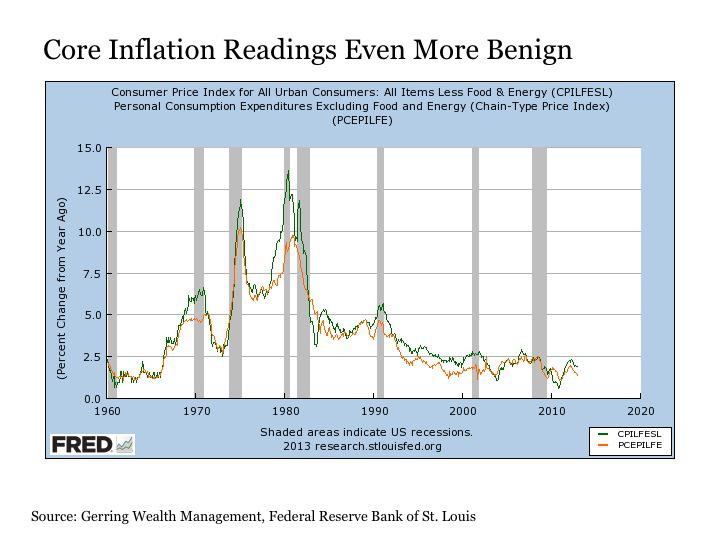
The
core inflation readings that exclude the more volatile food and energy
components reinforce further the idea that inflation is under control.
And these core figures are particularly important for these are the
readings that the Fed relies upon to monitor pricing pressures.
However,
the fact that both the CPI and PCE suggest that inflation is under
control does not necessarily end the discussion. It is important to note
that both readings are based on statistical models that are designed to
estimate changes in prices to the best of their ability. And I have no
doubt that those who have constructed and are maintaining these models
at the BLS and BEA are applying what they have determined to be the most
statistically accurate assessments of pricing. But it is important to
still point out that these are still estimations and not necessarily
statements of fact. For how a model is constructed and the inputs used
can lead to output that can vary widely over time.
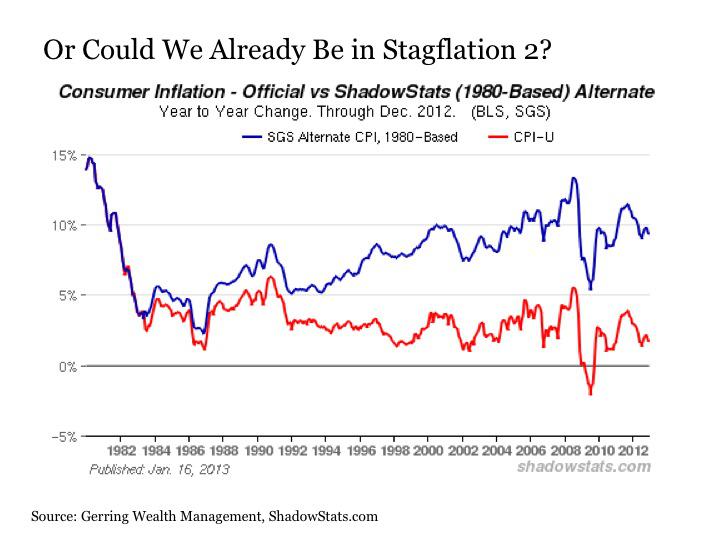
For example, John Williams at ShadowStats.com
provides alternative inflation charts focusing on the CPI. Recognizing
that the BLS changed their estimation methodology in both 1980 and 1990,
he provides a look at how inflation would look today if these previous
models were still in use. Under the pre-1990 model, inflation today
would not be considered under control but instead running fairly hot at
over 5%.

And
under the pre-1980 model, the talk today would likely be about the
return of 1970s style stagflation, not relative pricing stability.
These
examples do not necessarily suggest that we have an inflation problem
today. But what they do suggest is the possibility of an inflation
problem that may already be lurking undetected under the surface. Of
course, any conclusions about prices depend on the measuring methodology
in the end.
And who among the average consumer can really argue with the Fed's conclusions about price stability anyway.
Even if it feels like we may be paying much more for goods and services
than we did in the past, each of us are only one in a vast population
of consumers and are limited in our ability to clearly demonstrate that
we actually have an inflation problem today. It's not as though we have a
billboard that announces the daily price of goods and services in our
economy. This is true, of course, with the exception of one key item
that all Americans need to consume every single day.
What About Oil?
Let
us move forward under the assumption that pricing pressures are under
control, since this is what the Fed is seeing in their models. What then
has the potential to rattle the Fed's cage on the inflation front
whether it shows up in the official statistics or not? This product is
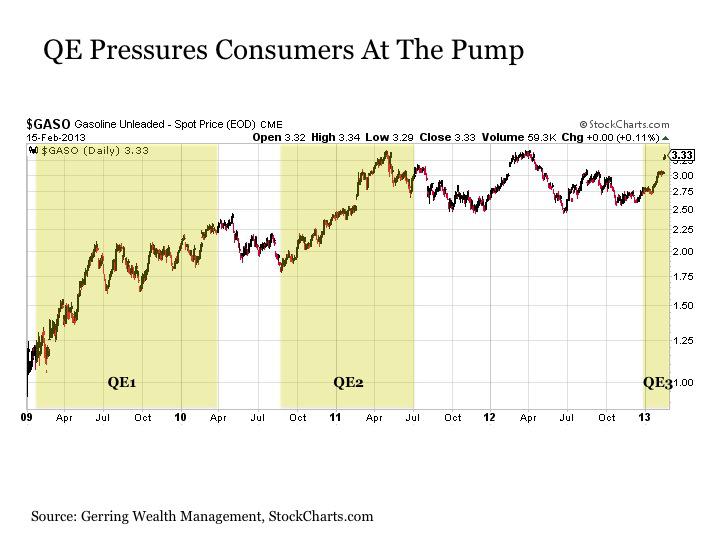
oil. And higher prices related to oil are already arriving at a gas
station near you thanks to the Fed's latest QE3 stimulus program.
The
fact that the Fed largely ignores food and energy prices in focusing on
the core inflation readings instead is another subject for debate in
the statistical modeling process. The justification for excluding these
two items is based on the notion that both categories experience highly
volatile price swings that fail to persist in a sustained price change
over time. But here's the problem. Whereas price changes in these
categories may not have persisted over time in the past, they have
absolutely persisted over the last decade.
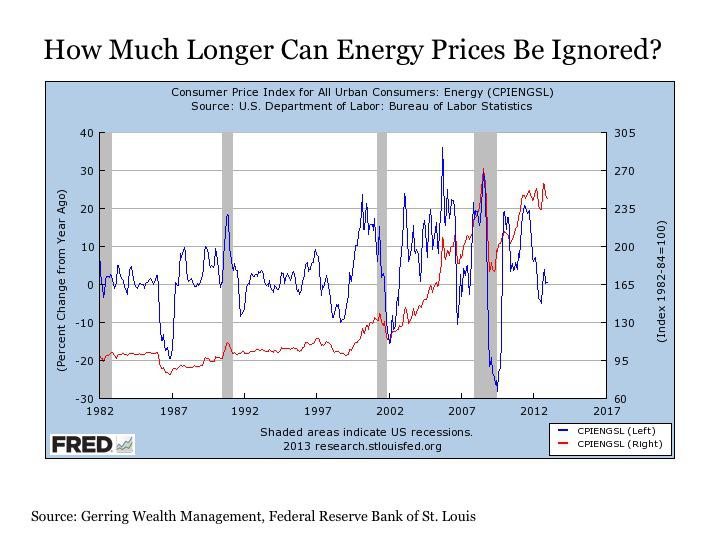
An
examination of energy in particular highlights this point. From the
early 1980s up until the year 2000, energy prices would experience wild
short-term swings (the blue line on the chart above) but underlying
prices would remain relatively stable (the red line on the chart above).
This, of course, began changing dramatically at the start of the new
millennium, as the violent price swings were not neutralizing themselves
out as they had in the past but instead have been accumulating into
sustained price increases at a rate of +7.5% per year on average over
the last decade. Putting this in simpler terms, the price of gasoline
was still consistently below $2 per gallon in the U.S. back in 2005.
Eight years later in 2013, the notion of seeing gasoline below $3 per
gallon seems far-fetched. And the prospects of gas prices rising
sustainably past $4 per gallon or even $5 per gallon in the near-term
are more than realistic.
In short, it is difficult to continue
looking past food and energy prices when assessing inflation, for the
increases in these categories are not only persisting but are also
increasingly serving as a tax on the purchasing power of consumers.
Unfortunately,
the Fed is stoking the fire under energy prices with its latest QE3
stimulus program. It is not just stock prices that float higher day
after day completely drunk on Fed liquidity. It is also energy prices
including the staple commodities of oil and gasoline. And dating back to
the beginning of the financial crisis, when the Fed has engaged in a QE
stimulus program, energy prices including gasoline have floated
steadily higher.
An
important distinction is worth noting about QE and asset prices. It's
not just any QE that gooses the prices of stocks and commodities higher.
Instead, it is specifically U.S. Treasury purchases by the Fed that
causes the market melt ups, for this specific strategy provides the
daily injections of liquidity that float the markets higher almost
daily. This is why the latest QE3 program launched in September 2012 was
falling flat in asset markets until recently, for it was not until
Treasury purchases commenced at the beginning of January 2013 that asset
prices began steadily inflating.
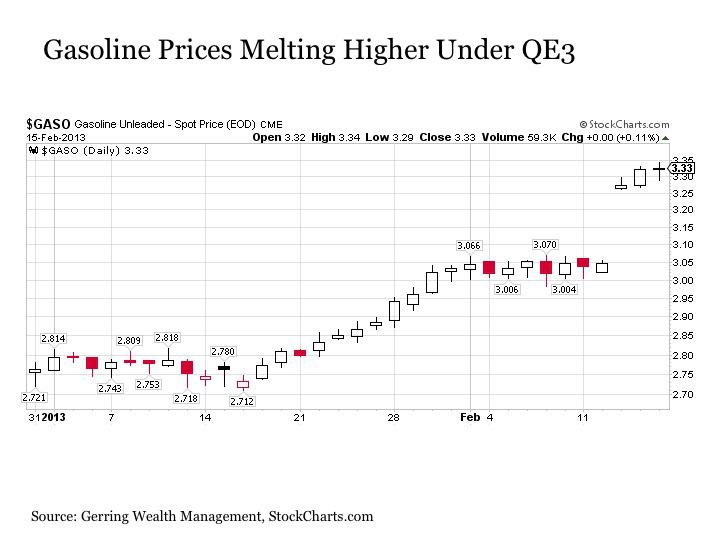
Since
the start of the year, the rise in gasoline prices has been both sharp
and persistent. Heading into 2013, the spot price of unleaded gasoline
was lingering between $2.70 and $2.80 per gallon. But once the forces of
QE finally latched on to gasoline prices starting on January 17, the
subsequent rise has been almost relentless. Over the past month,
unleaded gasoline prices have risen in 18 out of the last 22 trading
days. The cumulative effect has been a +20% rise in the spot price so
far this year.
In short, the Fed's dogged efforts to try and
increase stock prices for the roughly half of Americans that own stocks
today according to a Gallup poll in order to create a wealth effect that
just might marginally increase economic growth at some point down the
road is coming at a cost of effectively taxing all Americans today who
rely on gasoline to drive their cars and petroleum products to heat
their homes. No wonder we have yet to see any sustained benefit to the
economy from QE to date. Perhaps it is even hurting more than helping at
this stage.
The Fed's Pain Threshold For Higher Gas Prices
The
folks at the Fed are smart people. They have to know that QE is
directly juicing not only stock prices but also energy prices including
gasoline. And unlike nearly all other goods and services in our economy,
the price of gasoline is one that is projected on big billboards
throughout the streets of our respective towns each and every day. And
while companies can narrow the width of men's ties, cut down the length
of toilet paper rolls and shrink the size of popsicles in order to hide
price inflation in most other parts of the economy, a gallon of gasoline
is always going to be a gallon of gasoline. Thus, the price at the pump
is the one key data point on inflation where there is absolutely
nowhere to hide. The price of gasoline is announced loudly each and
every day, and it is critical to wonder exactly what the price threshold
will be when consumers begin to riot.
Looking ahead, it is highly
likely that we will see $4 per gallon gasoline perhaps as early as the
spring. And a run at $5 per gallon is certainly possible by the time we
are in the midst of the peak summer driving season. While it is almost a
given that the completely nonsensical, absolute garbage political
rhetoric about greedy oil companies will return to our airwaves if and
when this gasoline price rise occurs, the truth will remain that the
blame for the rise in energy prices will almost entirely rest at the
feet of the Fed. And whether they say so or not, they are smart enough
to know that this is true.
So exactly what gasoline price point
sets off public alarms remains to be seen. But it will become
increasingly difficult for Fed officials to justify to the American
people that we do not have an inflation problem when gas prices at the
pump are screaming higher. And this will be true whether the Fed is
receiving the blame for the price rise from the public or not. Whether
the rising price of gasoline ultimately proves to be Bernanke's
kryptonite for further QE will be a critical theme to watch as we move
into the middle part of the year.
In the meantime, it is
worthwhile to prepare your portfolio for such an outcome. And focusing
on oil and gas stocks that are highly correlated with rising energy
prices is an attractive theme. Representative names include Exxon Mobil (XOM), Chevron (CVX), Occidental Petroleum (OXY) and Apache (APA),
the last of which was absolutely drubbed late last week and is now
oversold on a variety of technical readings. BHP Billiton (BHP) is another attractive offering for a more diversified energy and mining allocation.
Feb 18, 2013
Berkshire Continues to Shift Cash Elsewhere

Berkshire Hathaway's BRK.ABRK.B
fourth-quarter 13-F filing, which details the firm's equity holdings,
continued to show evidence of the primary theme we've believed would
drive portfolio movements over the near term. Ever since Berkshire
appointed Ted Weschler and Todd Combs as investment managers, the firm
has been fairly active about selling legacy positions as part of an
ongoing process to raise capital for the two managers to invest.
The biggest sale during the period involved 28.8 million shares of Kraft Foods Group KRFT,
which, by our estimates raised around $1.1 billion for the firm. At a
little more than $75 million at the end of last year, Kraft is now one
of the smallest holdings in Berkshire's equity portfolio, and we'd be
surprised if the shares remained there much longer. As for the other sales during the period, Berkshire sold off another 165,000 shares of Johnson & Johnson JNJ,
whittling its stake in the health-care firm down to less than $23
million at the end of the year. Much like with Kraft, we expect Johnson
& Johnson to continue to be a source of cash for the managers at
Berkshire. The only other sale during the fourth quarter involved Lee
Enterprise LEE, which is now the smallest holding in Berkshire's equity portfolio.
Looking at the purchases during the quarter, Warren Buffett committed another $585 million to Wells Fargo WFC, which is now Berkshire's largest holding (at 20% of the total equity portfolio). DaVita DVA, General Motors GM, and DIRECTV DTV
all saw more than $200 million in additional capital allocated to them
as well during the period, with DaVita and DIRECTV both firmly placed
as top 10 holdings at Berkshire at the end of the year. As for the other purchases during the quarter, the firm increased its stakes in IBM IBM, Wal-Mart WMT, Liberty Media LMCAV, Precision Castparts PCP, and National Oilwell Varco NOV,
but the buys were relatively small compared with Berkshire's holdings
in these stocks. While there was a more meaningful purchase of Wabco
Holdings WBC, and new money purchases of Archer Daniels Midland ADM and VeriSign VRSN, these transactions paled in comparison with the company's $12.2 billion investment in Heinz HNZ announced yesterday.
Berkshire
Hathaway's economic moat has been built on the firm's record of
acquiring and managing a portfolio of businesses with enduring
competitive advantages. Whether through direct ownership of individual
companies or via significant stock holdings, famed value investor Warren
Buffett has typically looked to acquire firms that have consistent
earnings power, generate above-average returns on capital, have little
to no debt, and have solid management teams. Once purchased, these
businesses tend to remain in Berkshire's portfolio, with sales occurring
rarely. Buffett strives to raise capital as cheaply as possible to
support Berkshire's ongoing investments and measures the success of the
portfolio by per-share growth in intrinsic value. Given the current size
of the firm's operations, the biggest hurdle facing Berkshire will be
its ability to consistently find deals that not only add value but also
are large enough to be meaningful. The other major issue facing the
company is the longevity of Buffett and managing partner Charlie Munger,
both of whom are octogenarians.
Berkshire's most important business continues to be its insurance
operations. Not only do they contribute a meaningful amount of the
firm's pre-tax earnings, but they also generate low-cost float (the
temporary cash holdings arising from premiums being collected well in
advance of future claims), which has been a major source of funding for
investments. Berkshire underwrites insurance through three main units:
GEICO, General Re, and Berkshire Hathaway Reinsurance. GEICO, the
third-largest auto insurer in the United States, relies on direct
selling to consumers, a model that provides it with cost advantages over
some of its competitors. While this practice has become more common,
GEICO was a pioneer in the channel and continues to generate solid
underwriting profits and negative cost of float for Berkshire.
The firm's two other main insurance businesses are both reinsurers.
For a premium, these subsidiaries will assume all or part of an
insurance or reinsurance policy written by another insurance company.
General Re is one of the largest reinsurers in the world based on
premium volume and shareholder capital, while Berkshire Hathaway
Reinsurance's claim to fame is its ability to take on large amounts of
super-catastrophe underwriting, which covers events like terrorism and
natural catastrophes. These unique policies often contain large tail
risks that few companies (other than Berkshire, with its strong balance
sheet) have the capacity to endure. When priced appropriately, though,
these types of transactions can generate favorable long-term returns on
capital for the firm.
Berkshire's non-insurance operations encompass a wide array of
businesses, including Burlington Northern Santa Fe (railroad),
MidAmerican Energy (energy generation and distribution), McLane (food
distribution), Marmon (manufacturing), Shaw Industries (carpeting),
Benjamin Moore (paint), Fruit of the Loom (apparel), Dairy Queen
(restaurant), and See's Candies (food retail). Of the more than 70
non-insurance businesses in its portfolio, the two largest contributors
to Berkshire's pre-tax earnings are BNSF, which the firm acquired in
full in February 2010, and MidAmerican, in which Berkshire maintains a
90% stake, having initially added the company to its holdings more than a
decade ago.
Buffett's shift into such debt-heavy, capital-intensive businesses as
railroads and utilities is a marked departure from many of Berkshire's
past investments, which have tended to require less capital investment
and have had little to no debt on the books. While running railroads and
utilities requires massive reinvestment, Berkshire acquired these
businesses because they can earn decent returns on incremental
investments, ensuring that the large amounts of cash generated by the
firm's other operating businesses are reinvested in value-creating
projects. And while Berkshire does consolidate the debt of these two
subsidiaries on its own balance sheet, the firm guarantees none of it.
All of Berkshire's operating businesses are managed on a
decentralized basis, eliminating the need for layers of management
control and pushing responsibility down to the subsidiary level, where
managers are empowered to make their own decisions. This leaves Buffett
free to focus on capital allocation decisions and managing the
investments in Berkshire's portfolio--two things that he has been
extremely adept at doing over the past 40-plus years. While we could
argue that Buffett is not the sole reason for Berkshire's success, he
has been (and continues to be) a critical element in the firm's
competitive positioning. In our view, Buffett's ultimate departure would
cause the firm to lose some of the significant advantages that come
from having a capital allocator of his caliber at the helm.
We've
increased our fair value estimate for Berkshire Hathaway's Class B
shares to $117 per share from $110 after updating our valuation model to
account for changes in our assumptions about the firm's revenue,
profitability, and cash flows since our last update. Our new fair value
estimate is equivalent to 1.6 times Berkshire's reported book value per
Class B share of $74 at the end of the third quarter of 2012 (and 1.5
times our estimate of the firm's book value at the end of 2012). During
the last decade, Berkshire's Class A shares have traded in a range of
1.1-1.6 times book value, with a median value of 1.4 times.
Our fair value estimate for Berkshire is derived using a
sum-of-the-parts methodology, which values the different pieces of the
company's portfolio separately, then combines them to arrive at a total
value for the firm. We estimate that Berkshire's insurance operations
are worth $63 per Class B share, slightly higher than our previous
valuation owing to our belief that premium growth and underwriting
profits for the full year will come in better than we were originally
forecasting. We have not, however, altered our view on the firm's
investment income, which remains depressed because of the historically
low-yield environment (as well as the fact that several of the
high-coupon investments the firm made during the financial crisis have
been, or are in the process of being, paid off).
With regard to Berkshire's non-insurance subsidiaries, we believe the
manufacturing, service, and retailing operations are worth $22 per
Class B share, somewhat higher than our previous estimate, owing to the
ongoing improvements that continue to be seen in revenue and operating
profits throughout the division, even in the face of a slow recovery in
the U.S. economy. We estimate that Berkshire's railroad, utilities, and
energy operations are worth $29 per Class B share, also higher than our
previous forecast, due to the strength we continue to see at BNSF, as
well as the ongoing operating improvements and long-term investments
being made at MidAmerican. Finally, we estimate that Berkshire's finance
and financial products division is worth $3 per Class B share, which is
not much different from our previous forecast.
Berkshire
is exposed to large potential losses through its insurance operations.
While the company believes its super-catastrophe underwriting will
generate solid long-term results, the volatility of this particular line
of business, which can subject the firm to especially large losses,
could be high. That said, Berkshire maintains much higher capital levels
than almost all other insurers, which we believe helps to mitigate some
of the risk. Several of the firm's key businesses--insurance, energy
generation and distribution, and rail transport--operate in industries
that are subject to higher degrees of regulatory oversight, which could
have an impact on future business combinations and the setting of rates
charged to customers.
Berkshire also is exposed to foreign currency,
equity price, and credit default risk through its various investments
and operating companies. The firm's derivative contracts, in particular,
can affect Berkshire's earnings and capital position, especially during
volatile markets, given that they are recorded at fair value and,
therefore, are periodically updated to record the changes in the value
of these contracts. Many of the firm's non-insurance operations,
meanwhile, are exposed to the cyclicality of the economy, with results
typically suffering during economic slowdowns and recessions.
The
company is also heavily dependent upon two key employees, Buffett and
Munger, for almost all of its investment and capital allocation
decisions. With both men now in their 80s, it has become increasingly
likely that our valuation horizon will end up exceeding their expected
life spans, with the expectation being that investment returns and
capital-allocation quality will deteriorate under new management. The
2011 departure of David Sokol, who many had assumed would be Berkshire's
next CEO, has raised serious questions as well about the firm's
internal controls and, to some extent, tarnished its legacy of strong
ethical behavior.
Management & Stewardship
Warren
Buffett has been chairman and CEO of Berkshire Hathaway since 1970.
Charlie Munger has served as vice chairman since 1978. Berkshire has two
classes of common stock, with Class B shares holding 1/1,500th of the
economic rights of Class A shares and only 1/10,000th of the voting
rights. Buffett is Berkshire's largest shareholder, with a 34% voting
stake and 22% economic interest in the firm. He has been a strong
steward of investor capital, consistently aligning his own interests
with those of shareholders, and Berkshire's economic moat is derived
primarily from the success that he has had in melding the firm's
financial strength and underwriting ability with his own investment
acumen. Buffett's stewardship allowed Berkshire to increase its book
value per share at a compound annual rate of 19.8% from 1965 to 2011,
compared with a 9.2% total return for the S&P 500 Index.
This makes it even more important that Buffett's legacy remains
intact once he no longer runs the firm. Succession was not formally
addressed by Berkshire until 2005, when the firm noted that Buffett's
three main jobs--chairman, chief executive, and chief investment
officer--would probably be handled by one chairman (expected to be his
son, Howard Buffett), one CEO (with one candidate already identified but
not revealed), and three or more external hires (reporting to directly
to the CEO) to manage the investment portfolio. In our view, whoever
steps into Buffett's role as chief executive is going to feel more
pressure from shareholders and analysts than Buffett has ever been
subjected to. As such, the real long-term question for investors is
whether or not the individual that succeeds him can replace the
significant advantages that have come from having an investor of
Buffett's caliber, with the knowledge and connections he has acquired
over the years, running the show.
Overview
Berkshire's
financial strength was tested by the collapse of the credit and equity
markets in 2008, which ultimately led to the company losing its AAA
credit rating in 2009. That said, Berkshire remains one of the most
financially sound companies we cover, with the firm managing its risk
through diversification and a conservative capital position. While
Berkshire does not pay a dividend, the firm did initiate a
share-repurchase program during the third quarter of 2011 that allowed
management to buy back both Class A and Class B shares at prices no
higher than a 10% premium to the firm's most recently reported book
value per share. Berkshire altered the terms of the share-repurchase
program during the fourth quarter of 2012, with the board now
authorizing the firm to repurchase Class A and Class B shares at prices
no higher than a 20% premium to the firm's most recently reported book
value per share (which stood at $111,718 per Class A share, and $74 per
Class B share, at the end of the third quarter of 2012).
Profile:
Berkshire
Hathaway is a holding company with a wide collection of subsidiaries
engaged in a number of diverse business activities. The firm's core
business is insurance, run primarily through GEICO (auto insurance),
General Re (reinsurance), Berkshire Hathaway Reinsurance, and Berkshire
Hathaway Primary Group. The company's other businesses are a collection
of finance, manufacturing, and retailing operations, along with
railroads, utilities, and energy distributors.
Feb 15, 2013
Berkshire's Ore-Right buyout is a fantastic deal for Heinz shareholders.

Thesis 02/14/13
We've
long believed that Heinz is well positioned for the long term thanks to
its solid brand portfolio and expansive global sales and distribution
network, and it appears that others share our view, as the firm is now
set to be acquired by Berkshire Hathaway BRK.A BRK.B
and 3G Capital. The $28 billion deal values the packaged food firm
around 12 times our fiscal 2014 adjusted EBITDA estimate, which is
roughly in line with comparable multiples in the consumer product
category over the recent past. Despite intense competitive pressures and
rampant input cost inflation, Heinz has waded through the current
operating environment relatively unscathed, and we think its competitive
advantages should enable it to generate strong cash flows and returns
for shareholders over the longer term.
Above anything else, Heinz is known for its ketchup. However, its
products span several categories beyond the condiment aisle, including
sauces, soups, baked beans, baby food, and frozen foods. While the
namesake brand (which accounts for nearly 40% of the firm's annual
sales) possesses significant brand equity, the portfolio has another 15
brands that generate more than $100 million in sales annually. In our
view, Heinz is committed to enhancing its brand equity by continuing to
invest in marketing for core brands, which currently represent about
$300 million or nearly 2.5% of sales.
Although Heinz is the most globally diversified domestically based
packaged food firm (with total non-U.S. revenue accounting for 60% of
the consolidated total), management still believes there is room for
further expansion, and we agree. For instance, Heinz is squarely focused
on building out its distribution network by expanding in developing
markets. The firm has launched an infant formula product line in China, a
region ripe for growth, and recently announced acquisitions in China
and Brazil. We believe gaining entry into these regions by acquiring
local firms that are familiar with tastes and preferences in their home
markets is a wise investment, and from our perspective, these
initiatives won't saddle Heinz with additional debt, as ample cash
generation--free cash flow amounted to more than 9% of sales in fiscal
2012, which ended in April--will enable the firm to pursue more deals
around the world. Emerging markets account for about one fifth of
consolidated sales, and through a combination of internal growth (like
expanding the launch of infant formula) and additional acquisitions,
management is targeting that sales from these high-growth markets will
account for around 30% of total sales by fiscal 2016, which appears
achievable to us. In fact, under the ownership of 3G (which already
operates with a global portfolio of companies), more aggressive
expansion in emerging markets could now be in the cards, in our view.
Commodity cost inflation (particularly for resins, sweeteners, beans,
and meat) continues to plague packaged food firms, and Heinz is no
exception. The challenges don't end there, as prices throughout
the grocery store are trending higher, and we believe there is only so
much that today's fragile consumer is going to be able to
absorb--particularly in operating environments where unemployment levels
remain stubbornly high and austerity measures are constraining
discretionary spending. As a result, we think a focus on efficiency
improvements will be crucial. In light of these pressures, Heinz
announced that it intends to close an additional three factories
worldwide as part of its current restructuring efforts. This builds on a
plan announced in May to close five facilities around the world, trim
the workforce by 800-1,000 individuals (about 2%-3% of its global
employee base), and build a European supply chain hub. From our
perspective, these are worthwhile investments that stand to benefit
operations over the long term, despite the potential near-term hit to
profits.
Our
$72.50 fair value estimate for Heinz's shares reflects the all-cash
offer by Berkshire Hathaway and 3G Capital. We don't believe that
branded packaged food manufacturers or other financial investors will be
quick to cough up the funds necessary to make a sweetened bid for
Heinz, which management contends is the largest takeout deal in the
packaged food industry. As a result, we doubt competing bids will
surface. Further, we don't expect any roadblocks to prevent the deal
from going through.
We've long regarded Heinz--one of the most global of the U.S.-based
packaged food firms--as maintaining broad competitive advantages,
deriving from its expansive global scale and the brand strength inherent
in its refocused product portfolio, resulting in our narrow economic
moat rating. It appears that Warren Buffett shares our take. The Heinz
brand, which is on an array of products from ketchup to baked beans to
baby food, is a $4.5 billion global powerhouse, accounting for about 40%
of the firm's total revenue, and Heinz's top 15 brands (each of which
results in more than $100 million in annual sales) drive about 70% of
revenue every year. In addition, Heinz generates a boatload of
cash--free cash flow averaged nearly 10% of sales annually over the past
five years--and we bet that Berkshire found this to be quite
attractive.
With
about 40% of its total revenue resulting just from the Heinz brand, the
firm depends on the perception of its namesake brand among consumers.
Volume could remain under pressure as consumers remain cautious and
intense competitive pressures from other branded players and
private-label offerings persist. Finally, given that 60% of its sales
and more than half of its operating income are derived from
international markets, the firm is exposed to fluctuations in foreign
exchange rates.
Management & Stewardship
Overall,
we think Heinz's stewardship of shareholder capital is standard. The
firm's returns have exceeded our estimate of cost of capital over the
past 10 years, which is impressive. In addition, we are encouraged that
the firm has focused on returning excess cash to shareholders (through
dividends and share buybacks) while also pursuing strategic
acquisitions in order to build up its position in faster-growing
emerging and developing markets. Although Heinz has been reluctant to
disclose the price paid for most of these deals, we take some comfort
that it is being a prudent steward of capital, given that profitability
levels have not deteriorated. We expect that the firm will continue
looking to further expand in these regions through bolt-on deals, but we
caution that with several consumer product firms looking to developing
markets for expansion opportunities, valuation multiples could trend to
insanely high levels, making such deals less beneficial.
Berkshire Hathaway and 3G Capital's $28 billion buyout of Heinz
(which values the packaged food firm at around 12 times our adjusted
fiscal 2014 EBITDA estimate) strikes us as a great deal for
shareholders. William Johnson, 63, has been CEO since 1998 and chairman
since 2000. We believe Johnson brings extensive knowledge and experience
to the table, as he has spent more than 25 years at Heinz. Details
surrounding the management structure post-deal, though, have yet to be
determined.
Overview
Although
Heinz operates with a significant amount of leverage, we are comforted
by its cash generation. At the end of fiscal 2012, total debt stood at
0.6 of capital, but operating income covered interest expense around 5
times. Over the next five years, we forecast debt/capital to average 0.5
and earnings before interest and taxes to cover interest expense more
than 7 times on average. We are placing our A- issuer credit rating
under review, with the caveat that we expect to drop the rating once the
acquisition is completed as we do not rate Berkshire. We don't
anticipate any roadblocks to the deal's completion.
Profile:
Since
its founding more than 110 years ago, H.J. Heinz has grown into a
globally diversified manufacturer and marketer of packaged foods,
selling through grocery stores, convenience stores, and food-service
distributors. Its products include ketchup, condiments, sauces, frozen
food, soups, beans, pasta meals, infant nutrition, and others; its
namesake brand accounts for about 40% of annual sales. International
sales account for 60% of the firm's consolidated total.
Feb 12, 2013
World merchandise trade and world industrial output reached new record highs in November
Posted in Carpe Diem Blog

The CPB Netherlands Bureau for Economic Policy Analysis released its monthly report a few weeks ago on world trade and world industrial production for the month of November 2012. Here are some of the highlights:
1. World merchandise trade volume increased in
November by 0.8% on a monthly basis and by 2.7% on an annual basis,
bringing the global trade index to a new all-time record high of 168.8
(see blue line in chart). World trade is now 5.4% above the previous
April 2008 peak of 160.2 in the early days of the US and global
recessions, and world trade hasn’t declined on a year-over-year basis
since October 2009.
2. By region, annual export growth was led by Central and Eastern
Europe at 9.4%, followed by Emerging Asia at 4.9%. Annual import growth
was led by Africa and Middle East at 11.7%.
3. World industrial production increased
by 0.6% in November from the previous month, following a 0.5% increase
in October, and by 3.3% on an annual basis, reaching a new all-time high
of 148.7 (see red line in chart), with especially strong annual output
growth in Emerging Asia (10.3%) and the US (2.9%). Output declined in
Europe (-3.5%) and Japan (-6.7%) on an annual basis through November. On
an annual basis, world output hasn’t declined since November 2011.
4. World industrial output is
now 10.1% above its previous recession-era peak in February 2008
(135.0) and 26% above the recessionary low of 118.1 in February 2009.
Bottom Line:
Both world trade volume and world industrial output reached fresh
record monthly highs in November. Trade (5.4%) and output (10.1%) are
now far above their previous peaks during the early months of the global
slowdown, providing evidence that the global economy has now made a
complete recovery from the 2008-2009 recession.
Update: I’m pretty sure that the world trade and world output data are adjusted for inflation, see explanatory note here from the CPB. Additionally, IMF data on world GDP available here indicate
that world GDP increased by 16.4% between 2008 and 2012 in nominal
dollars, and by 12.1% in constant dollars, which would be consistent
with the 10.1% increase in world industrial output over roughly the same
period.
Global economic growth is expected to accelerate
|
Posted in Carpe Diem Blog

The chart above displays annual world GDP growth rates (adjusted for inflation) from 1980 to 2012 (actual) and 2013 to 2017 (projected), using data from the International Monetary Fund’s (IMF) World Economic Outlook Database. According to its most recent “World Economic Outlook”
(released January 23), the IMF is reporting 3.2% real growth in world
GDP for 2012, which is expected to increase to 3.5% this year and 4.1%
next year. Economic growth is expected to be especially strong this year
and next year in China (8.2% and 8.5%), India (5.9% and 6.4%) and
sub-Saharan Africa (5.8% and 5.7%). For the years 2015-2017, the IMF
projects above-trend growth in world output of about 4.5% in each year.
The chart above also shows the
steep, upward trend line for world real GDP since 1980. Due to increased
productivity, technological improvements, greater world trade, and the
spread of free market capitalism around the world among other positive
long-term trends, the trend in world economic output has increased by a
full percentage point in the last thirty years (see blue trend line
above), from less than 3% in 1980 to 4% today. And just a one
percent increase in the growth rate of real output makes a big
difference over time – at 3% growth, real world GDP would grow from the
current level of $70 trillion to $302 trillion in 50 years; at 4%
growth, real world GDP would be 60% higher in 50 years at $485 trillion.
Bottom Line:
Despite a global slowdown, and a severe financial, mortgage and housing
crisis in the US, the world economy contracted in only one year, with
negative growth of 0.57% in 2009; and that was followed by a healthy
rebound of 5.1% real economic growth the following year. One year of
a contraction in global output doesn’t seem so bad during a 35-year
period of strong global expansion, characterized by a positive upward
trend in world economic activity that has boosted the annual growth rate
in global output by a full percent since 1980.
|
|
|
Feb 11, 2013
If top 500 US manufacturing firms were a separate country, they would have been the third largest economy last year
From Carpe Diem Blog
| Rank | 10 Largest Manufacturing Industries, 2012 | Revenue (Millions) | Examples |
|---|---|---|---|
| 1 | Petroleum & Coal Products | $1,629,494 | Exxon, Chevron, Conoco |
| 2 | Computers & Other Electronic Products | $814,172 | HP, IBM, Apple |
| 3 | Chemicals | $441,233 | P&G, Dow, DuPont |
| 4 | Food | $387,855 | General Mills, Kellogg, Campbell |
| 5 | Motor Vehicles | $333,693 | Ford, GM, Harley-Davidson |
| 6 | Pharmaceuticals | $317,763 | J&J, Pfizer, Merck |
| 7 | Machinery | $263,840 | Caterpillar, Deere, Xerox |
| 8 | Aerospace & Defense | $260,360 | Boeing, Lockheed Martin |
| 9 | Electrical Equipment & Appliances | $248,864 | GE, Emerson, Whirlpool |
| 10 | Motor Vehicle Parts | $137,552 | Johnson Controls, Cummins, TRW |
| Total | $4,834,826 |
IndustryWeek recently released its annual ranking of the 500 largest publicly held US. manufacturing companies
in 2012 based on sales revenue, and the top ten US manufacturing
industries (of 27 total industries for the Top 500 companies) are
displayed above. Here are some factoids:
1. The combined sales revenue
(including global sales) of the top 500 US-based manufacturing firms in
2012 was $6.01 trillion, which was a 17.2% increase over 2011 sales of
$5.13 trillion. To put those sales in perspective, if those 500 US
manufacturers were considered as a separate country, their revenue last
year of $6.01 trillion would have ranked as the world’s third’s largest economy behind No. 1 US and No. 2 China, and slightly ahead of No. 4 Japan’s entire GDP of $5.98 trillion in 2012.
2. The sales revenue from the top
ten US manufacturing industries totaled $4.83 trillion in 2012 (see
chart above), which was 44% more than Germany’s entire GDP of $3.36 trillion last year.
3. Annual sales of $1.62 billion
in 2012 for America’s single largest manufacturing industry – petroleum
and coal products – was larger than the GDP of Australia last year of
$1.54 trillion, and almost as much as Canada’s $1.77 trillion in GDP in
2012.
4. Annual sales of $814 billion for America’s second largest
manufacturing industry – computers and other electronic products was
more than the entire GDP last year of Turkey ($770 billion) and Saudi
Arabia ($657 billion).
5. The top ten largest U.S. manufacturing companies (Exxon, Conoco,
Chevron, GM, GE, Ford, H-P, Valero, Apple, and IBM) had combined
revenues of $1.87 trillion, more than Canada’s GDP in 2012 of $1.77
trillion and almost as much as the entire GDP of India ($1.94 trillion).
The
comparisons above help put the enormous size of the U.S. manufacturing
sector into perspective and demonstrate that American manufacturing is
not withering and disappearing, but thriving, expanding and prospering.
In 2011, US manufacturing companies as a group had their best year ever
in terms of after-tax profits by far, with almost $600 billion in
after-tax earnings according to the Department of Commerce.
Based on data through the third quarter of 2012, manufacturing profits
will likely slip in 2012 to about $570 billion, but that will still be
the second-best year ever for manufacturing profits, and almost 30%
above the pre-recession level of $442 billion in 2007. Despite the
persistent rumors of its pending demise, American manufacturing is alive
and well, and getting better every year.
Feb 5, 2013
Warren Buffett's $34 Billion Presidential BRIBE
(Article from Energy & Capital)
How the world's greatest investor bought his own set of legal loopholes that could earn him — and YOU — 519% gains in the coming months
Fellow Investor,
In early July 2010, Warren Buffett made a controversial telephone call to the White House.
The world's most prolific investor needed a favor.
At the time, Obama's Press Secretary, Robert Gibbs, said, "He wanted
to come in and see the president, and you don't turn down the
opportunity to talk to Warren Buffett."
And it's true...
Even the president of the United States doesn't say "no" to the second-richest American — especially when there's a deal to be cut.
Here's the rub:
Buffett had just made the biggest investment of his career: a $34
billion purchase that put him in position to have a virtual monopoly in
one of the hottest and fastest-growing oil fields in the world.
Production at this oil field is growing an astounding 30% to 50% a year.
Virtually all of America's biggest oil companies — Exxon, Hess, and
Continental — have a heated interest in this huge, dynamic oil field.
There was just one thing missing for Buffett...
One small piece of legislation in Congress had the power to prevent
Buffett from securing a lucrative, long-term stranglehold on America's
fastest-growing oil field.
If Buffett could just find a way to get that nagging bit of
legislation killed, it would all but guarantee his $34 billion monopoly
would be the single most profitable investment he ever made.
All he needed was one small favor from the president...
On July 14, 2010, Warren Buffett and President Obama met
behind closed doors at the White House. It was during this private
meeting that the two made a historic deal that would benefit both men
greatly.
Just a few months later, we started hearing about the "Buffett Rule,"
a new tax rule that would raise taxes on America's wealthiest people.
In return for his endorsement of this divisive tax plan, Buffett
received certain favors that guaranteed his latest investment would be a
multi-billion-dollar winner.
As you might expect, Buffett has already made a small fortune on this deal...
In fact, in about three years, this deal has been worth more than $22 billion for Buffett.
But the most important thing is that, as this moves forward,
individual investors now have a chance to get in and grab up to 519%
gains...
And that's why I'm revealing the details of "Buffett's Bribe" today...

In fact, Buffett's low-risk profit from this backroom deal will likely run as high as 25% per year — for the next 10 years.
At that rate (a very conservative one, I might add) your total haul would be 519%.
I've run the numbers every way 'til Sunday, and they're dead-on
(though I should tell you my profit estimates may actually be on the low
side)...
Quite simply, individual investors don't usually get the chance to follow a top investor into such an easy profit situation.

That's why I'm exposing this story to you now.
Because if you choose to act, you could do just as well as Buffett will on this deal... and maybe even better.
These Easy 519% Buffett Profits Can be YOURS
You probably know that Warren Buffett is no stranger to making
lopsided deals — deals that make him a lot of money, with very little
risk.
In fact, he's made a career of it.
And there's a good reason for this.
You see, a "Warren Buffett investment" is more than just a cash position...
It's credibility, too. Warren Buffett's reputation as the world's greatest investor means companies actively seek out investments from the Oracle of Omaha. And once a company gets the "Buffett Seal of Approval," the stock price inevitably rises...
Just check out this little timeline:
- Lehman Brothers went bankrupt on September 15, 2008. This debacle sent the stock market into a free fall. Financial stocks were among the hardest hit. The Financial Select ETF plummeted 32% over the next three weeks.
- Eight days later, while investors around the world panicked, Buffett invested a cool $5 billion in Goldman Sachs.
- While there's no proof Buffett had advance intel that the $700 billion TARP bailout was coming, he told CNBC, "If I didn't think the government was going to act, I would not be doing anything this week..."
- Within a few weeks, Goldman hit a low of $53.31. They then got $10 billion in TARP funds, and by the end of 2009, shares were at $165.
- Buffett made around $10 billion. YOU could have made a nice stake as well by following the guru to 209% gains.
- Less than a month later, Buffett invested $3 billion in GE (who then got an unprecedented $139 billion guarantee for its debts). The stock bottomed at $7.06... but was pushing $20 within a year.
- Again, you could have followed Buffett to netting 170% gains.
Pretty incredible, if you ask me. The crazy thing is there's more...
- Buffett followed his GE play with a Bank of America deal that analysts have described as "ruthless." In August 2011, he took a $5 billion position in the bank.
- BoA had been selling off all through the year, dropping from over $14 per share down to $6.30. Yet, once Buffett plunked down his cash, the stock jumped 26% on the very day the deal was revealed.
- By March 2012, the stock was up to around $10. That's a 95% gain for Buffett — and gains YOU could have pocketed as well.
There is no doubt Warren Buffett ensures the odds are in his favor when he invests. You don't put billions of dollars at stake without knowing a few things...

That's why his latest move is such a perfect opportunity — but ONLY for folks who take advantage quickly.
As I've shown you, there's a pretty quick turnaround on these deals.
The gains happen in as fast as a month... so only those with early
stakes truly see the full gains.
Now, I want to be clear: I'm not recommending Bank of America, or General Electric, or Goldman Sachs as an investment for you at this time...
No, I've found a much better
opportunity for savvy investors — an investment that will inevitably
profit from the twin forces of Buffett's savvy and America's production
of fossil fuels.
This is about as powerful a one-two punch as I can imagine.
You Can TRIPLE the Market's Gains — for the NEXT 10 YEARS!
Hello, my name is Brian Hicks. I'm the founder and president of a multi-million-dollar investment research firm called Angel Publishing.
I'm the founder and president of a multi-million-dollar investment research firm called Angel Publishing.
Much like how an "angel investor" provides cash for a promising
start-up company, my firm provides profitable investment research for
individual investors tired of being victimized by Wall Street's
profiteering.
I've seen a lot in my 18 years in this business. I've traveled on
wealthy investors' yachts, participated in venture capital funding of
start-up companies, drinks and dinners with CEOs — you name it.
I don't really have time for the investment conference circuit any
more. Those trips to New York, San Francisco, and New Orleans are too
much of a grind on a family man like me.
And I got tired of sharing my profitable insights on CNBC, Bloomberg and Fox News...
They never knew what to do with a real-life profit opportunity.
I'd rather focus on my true measure of success: the thousands of
investors who have used Angel Publishing research to secure mammoth
paydays for themselves.
In fact, I keep a special file cabinet for the letters from
individual investors like you that have paid off their homes, sent their
kids to college, and bought brand-new cars with the profits they've
taken...
Like Cheryl, who wrote to say:

Here's what Mike said:

Judy had this to say:

N.W. took the time to tell me:

These investors are no different than you. All they did to achieve
life-changing wealth was act on the recommendations they received from
me and my staff of forward-thinking analysts.
Now I'm exposing an incredibly simple, safe, and profitable situation that could help you secure 519% gains.
It's a "Warren Buffett" investment, so you know it's safe and very likely explosively profitable.
And because it involves one of the hottest oil fields in America, there's tremendous upside.
How can I be so sure that you can make five times your money safely and easy?
Simple...
First, as I've said several times, this is a "Warren Buffett"
investment we're talking about. It's all but guaranteed not to lose
money.
Buffett's unique position has allowed him to make $4 billion in
cash — plus capital gains of approximately 72% on this deal already. In
other words, he's up around $22 billion in just three years.
This is exactly the type of investment he's used to make himself the second richest man in America...
And it can help make you wealthy, too.
Second, we're talking about a small group of stocks with significant
upside. Given recent earnings growth for these companies, these stock
prices should grow +20% a year... for the next 10 years.
Most investors simply have no idea how bullish the outlook is for these stocks.
Finally, there are above-average dividends involved that will juice
your profits even higher. These are the kind of dividends that can shore
up any retirement portfolio and create wealth for generations to come.
Plus, these dividends are prime candidates to get much bigger in the near future (I'll show you why in a minute)...
My research indicates this investment should easily turn an average of 25% every year for the next decade.
Now, 25% gains over the course of 12 months may not sound like
much... but if you can grow your money at that rate for 10 straight
years, you're talking about a 519% profit.
And this will be one of the easiest and safest 519% gains you've ever
seen (and these days, I'm sure you know that worry-free profits are
worth their weight in gold). Not only that, but in just a few years' time, you could be cashing
dividend checks equal to 40% of your initial investment — just like
Warren Buffett does on investments like Coca-Cola.
He now cashes $400 million checks every year on his original $1 billion investment in Coke.
Starting today, you could safely and easily set yourself up to
receive huge annual paydays, no matter what the economy or stock market
does.
It's like getting thousands of dollars in "free" money every year.
This is fortune-building the Warren Buffett way.
The Real Buffett Rule:
You Scratch My Back, We ALL Make Money
Maybe you've heard of Warren Buffett's Two Rules of Investing...
Rule #1: Don't lose money.
Rule #2: Don't forget Rule #1.
Yeah, Buffett's got a pretty good sense of humor. But when it comes
to his investments, he's not joking around. No one should be surprised
to learn he will do whatever it takes to guarantee he comes out a winner.
He's not going to lose money (and you won't either).
Sometimes, that means Buffett crosses the line and invests on insider information.
Of course, no one can prove anything. But we can certainly ask some questions, like:
- Did Warren Buffett have insider information that government bailouts were coming to the financial sector when he invested in Goldman Sachs? Or was the fact that Goldman got $10 billion in TARP funds just weeks after Buffett invested a profitable coincidence?
- Did the FDIC give Buffett a heads-up that it would back $169 billion in GE debt, paving the way for him to make billions? After all, that $169 billion guarantee came just a month after Buffett's $3 billion GE investment...
- Was Buffett tipped off that Bank of America would pass its "stress test," clearing the way for billions in profits? Most investors felt that Bank of America would not pass the stress test due to billions in mortgage liabilities.
Given Buffett's status as a billionaire investor and businessman,
it's easy to imagine he gets access to people and information that are
simply off-limits to the rest of us.
It's also clear that companies like GE and Bank of America were eager
to align themselves with Buffett, as they're well aware that a Buffett
investment would give other investors the confidence to invest at a time
when there was much uncertainty about the companies.
And this time, it goes even deeper than that...
When you consider Buffett's cozy relationship with Obama and members
of his administration, it shouldn't come as a surprise that there's been
an attitude of "you scratch our backs, we'll scratch yours."
So...
If you've ever been curious as to why Warren Buffett is the only prominent businessperson to consistently endorse President Obama...
If you've ever thought there was something unusual about Obama's "Buffett Rule" that would raise taxes on the wealthy...
Then please read on, because this story gets even more interesting — and potentially profitable for you.
Warren Buffett's $34 Billion Bakken Oil Buy
On Tuesday, November 3, 2009, Warren Buffett completed a $34 billion deal — the biggest in Berkshire Hathaway's history.
The target? America's second largest railroad: Burlington Northern Santa Fe (BNSF).
At the time, Buffett said: "Berkshire's $34 billion investment in
BNSF is a huge bet on that company... and the railroad industry... Most
important of all, however, it's an all-in wager on the economic future
of the United States. I love these bets..."
I expect that when we hear the words "all-in wager on the economic
future of the U.S.," many investors assume Buffett is talking about
growing, spending, and the need to ship goods around the country via
railroads...

But the true insight behind Buffett's railroad investment shows much more savvy.
In fact, the real reason he put up $34 billion for the
Burlington Santa Fe railroad is what makes this such a significant
profit opportunity for you.
And the fact that Buffett — once again — has stacked the deck to
favor his investment means these profits are virtually guaranteed.
Because when Buffett bought the Burlington Northern railroad, he
didn't have his sights set on shipping corn, or soybeans, or furniture.
No, he was buying unfettered access to the very key to America's economic future: fossil fuels. And not just any fossil fuels...
Buffett's Burlington Northern is the main supply line for America's hottest oil play...

I'm talking about North Dakota's Bakken Shale Oil Field.
The Bakken is America's fastest-growing oil field. And the Bakken
discovery has been a godsend — it's put the American oil industry back
on the map.
You see, U.S. oil production peaked back in 1984 at 8.9 million
barrels a day. Oil production then declined every year for the next 24
years, finally hitting bottom in 2008 at 4.9 million barrels a day. (No
surprise oil prices hit their highs in 2008.)
But according to the Energy Information Administration (EIA), 2012
production was up 29% from the 2008 low... 2013 should see 6.7 million
barrels a day — an amazing 37% increase in just five years.
To put that in perspective, 60% of America's oil was imported in 2005. Today it's just 42%.
And nowhere is the boom in American oil production more pronounced than in North Dakota's Bakken Oil Field.
The Bakken: America's Fastest-Growing Oil Field
It's pretty simple, really.
The Bakken Shale Oil Field in North Dakota has billions of barrels of
recoverable light, sweet crude oil. Estimates range from 6.3 billion
barrels to over 30 billion barrels of oil.
Yes, that's a wide range, for sure. And it's also true there's still a lot that's unknown about the Bakken.

But what we do know about this oil field is this:
- It's the fastest-growing oil field in the U.S.: 2011 production was 152 million barrels; 2012 production hit 190 million barrels.
- Bakken shale oil is light, sweet crude — every bit as good as the best Saudi Arabian oil.
- Bakken land prices continue to rise.
- Warren Buffett spent $34 billion to get exposure to Bakken oil production.
Production figures and reserve estimates are one thing, but when the
world's greatest investor puts his money on the line — $34 billion of it
— that's the best sign yet that there's safe, easy profits to be made.
After all, Buffett doesn't like risk and he doesn't take chances.
He only invests in "sure thing" winners...

Like Goldman Sachs and GE in 2008. Like Bank of America in 2011.
And like the $26 billion in profits he's already made on his $34 billion
investment in just three years.
It's well-known that Buffett has no problem throwing his weight around to get the best deal possible.
And as I'll show you, he went to some extraordinary lengths to ensure his $34 billion deal would be a long-term winner.
Buffett's Bakken Deal: Game of Thrones
As I documented before, Warren Buffett requested a private meeting
with President Obama in 2010. The two men sat down behind closed doors
on July 14 of that year.
According to a White House official, the two men met "to discuss the
economy and our ongoing efforts to work with the private sector to
stimulate growth and create jobs."
But the evidence says it was at this meeting that Buffett got what he
needed to guarantee himself — and you, if you so choose — a ten-year
supply of consistent, market-beating profits.
You know what the president got... Just a few months after this
high-powered meeting, Obama began making political waves with the
Buffett Tax Rule.
And what did Buffett get? He got the proposed legislation for the Keystone XL Pipeline killed.
That's right. This is one of the boldest examples of backdoor dealing I've ever encountered.
You see, the Keystone Pipeline was proposed by the TransCanada
Corporation to carry oil from Canada's oil sands to the Gulf of Mexico.
It would also provide a much-needed link to North Dakota's Bakken oil
field.
There was a huge outcry when Obama killed this pipeline proposal.
Maybe you heard that the Keystone Pipeline was killed for
environmental reasons... or maybe you saw the reports that Obama nixed
the Keystone proposal because the bill was being fast-tracked.
But those reasons are just a smokescreen.
So far as I'm concerned, the REAL reason the pipeline was scrapped was Warren Buffett.
You see, without the Keystone Pipeline to move their oil to market,
the Bakken's oil producers are forced to turn to — you guessed it —
railroads. And not just any railroad...
Buffet's Burlington Northern Santa Fe is the only American railroad that serves North Dakota's Bakken.
It couldn't be any more obvious:
- The Washington Times said: "Warren Buffett... stands to benefit from the president's decision to reject the Keystone XL oil pipeline permit."
- Alison Ritter, of the Department of Mineral Resources noted: "Oil that would have moved by the Keystone XL is now going to shift to rail transportation."
- A BusinessWeek reporter pointed out that Burlington Northern has a "bigger position in what I think in the next cycle will be faster-growing elements — intermodal, the Bakken, international grain."
- Justin Kringstad, director of the North Dakota Pipeline Authority, said rail shipments are expected to "increase exponentially with increased oil production and the shortage of pipelines."
Talk about a sweetheart deal.
Buffett now has +190 million barrels of Bakken oil in his back
pocket. Right now his railroad hauls around 25% of Bakken oil... and
profits and revenue are way up.
But with a newly won monopoly on Bakken oil, surely you don't expect Buffett to be satisfied with just 25%...
He's already expanding the railroad's capacity to be able to handle up to 70% of the light, sweet crude coming out of the Bakken.
Railroad profits will go through the roof — and so will the stock prices (and the dividend payments)!
Buffett's Bakken Oil monopoly has shined a profit spotlight on an
overlooked and unloved group of stocks: the railroads. For individual
investors, this is the ground floor of a powerful, long-term bull market
for a select few railroad companies.
Easy Profits from Buffett's Oil Monopoly
Earning life-changing wealth from the stock market doesn't have to be
risky, difficult, or time-consuming. In fact, it can be downright
simple.
Just take a look at what the world needs most right now...
Energy. Power. The fuel to turn the economic engine.
It's no coincidence the U.S. economy started struggling when oil
prices broke sharply higher in 2007 and 2008. But now, America's oil
production is growing for the first time since 1991. Oil imports are falling. And a select few railroads are vital to America's growing energy independence.
Warren Buffett knows this...
But still, most investors are simply unaware of the advantages of railroad shipping.
For years, the railroads have been a dying industry: rusting rails,
rotting ties, slow locomotives belching black clouds of smoke.
But the fact is the railroad industry is undergoing a stunning rebirth, much like America's oil industry.
New rails are being laid... decommissioned routes are being put back
online... new railcars and engines are being built at the fastest pace
in 25 years.
Why? Because it's cheaper to ship by railroad than an 18-wheeler — by a factor of 10.
According to the U.S. Department of Transportation, a train gets
about 100 miles per gallon per ton of cargo, while a truck gets just 10
miles per gallon for the same payload.
One standard railcar can hold up to 100 tons of densely packed
freight; to ship that much by truck would take four standard
tractor-trailers.
That means the average train hauls as much freight as 280 trucks.
And these days, with diesel selling for over $4 a gallon, Buffett
clearly understands the fuel efficiency of trains is an attractive
alternative to trucks.
But it doesn't end there...
Because as important as fuel efficiency and shipping goods is, it's
the massive oil and natural gas boom in America that will keep driving
these trains to higher and higher stock prices.

Let's consider the Bakken Oil Field again. In February 2012, Bakken
crude oil prices plunged to $71 a barrel, even though West Texas oil
prices were steady around $100.
What could possibly cause such a huge drop in price for the Bakken's high-quality oil?
Pipelines.
There's simply not enough pipeline capacity to handle the 700,000
barrels of oil coming out of the Bakken every day. And when a surplus
builds, prices fall.
In fact, current pipelines can only handle around 400,000 barrels of
Bakken oil a day. That leaves 260,000 barrels a day that for the
railroads. That's why Buffett's railroad runs between 660 and 990 oil
cars out of
North Dakota every single day.
And it gets even better for Buffett, because Bakken oil production is
expected to hit 1 million barrels a day in the next two years... and
Buffett is expanding his railroad to be able to haul 700,000 of those
barrels.
You've got to hand it to Buffett. He's used his influence to lock in a consistent, long-term profit source.
And now you can lock in the exact same long-term profit source, safely and easily...
Because the energy-driven boom for railroad companies has only just begun.
Start the Clock to 519% Gains TODAY!
According to the U.S. Energy Information Administration, (EIA) rail
deliveries of oil and petroleum rose almost 40% in the first half of
2012.
You can see it on charts like this one:

And it's not just North Dakota's Bakken...
The Association of American Railroads says overall, U.S. rail shipments of oil have nearly quadrupled
in a year: 88,026 railcar loads of oil were shipped in the first half
of 2012, up from only 22,714 in the first half of last year. And each
car can carry 700 barrels of oil.
It's critical you understand the huge jump in oil shipments by railroad is happening throughout North America.
In other words, Buffett's not the only one who's making out like a bandit...
 One railroad company recently told attendees at an investor conference
the company expected oil shipments it carries to rise from 13,000
carloads last year to at least 70,000 carloads sometime in 2013.
One railroad company recently told attendees at an investor conference
the company expected oil shipments it carries to rise from 13,000
carloads last year to at least 70,000 carloads sometime in 2013.
There should be no doubt that oil shipments by railroad will continue
to increase. After all, U.S. oil production is expected to nearly
double — from 6 million barrels a day to 11 million barrels a day in the
next 10 years.
And most investors simple have no idea this is happening...
There's no doubt oil shipments will continue to push railroad stocks
higher for at least the next 10 years. But you should know it's not just
oil...
The railroads also play an indispensable role in developing America's immense natural gas resources.
Most investors don't know it, but hydraulic fracturing — the process
by which oil and natural gas-rich shale rocks are broken apart to
release the fossil fuels — is completely dependent on railroads.
Why?
Sand.
Every natural gas well in America that uses hydraulic fracturing, or
fracking, requires between 3,000 and 10,000 tons of sand. And 13,000 new
shale gas wells are drilled every year.
Just a couple weeks ago, the Minneapolis Star-Tribune said:
"Hydraulic fracturing — the oil drilling technique widely known as
'fracking' — has created a major new business for railroads, because
each horizontal well requires between 3,000 and 10,000 tons of sand."
And as it happens, Minnesota and neighboring Wisconsin are home to the biggest sand mines in America.
Now, I'll confess I was unaware sand mines were big business until
recently. But did you know Wisconsin alone has 60 new sand mines in the
works?
And railroads are the only way to move that much sand.
One railroad has already seen a 265% increase in fracking sand
shipments in the last 24 months. This company is investing millions to
open up new tracks in Wisconsin and Minnesota to get even more sand to
market.
And with 60 new sand mines coming online, this railroad will be plenty busy...
STOCK GUMSHOE EXPLAINS:
So which one is the “top rated railroad stock” in this special
report? Thinkolator says it must be Union Pacific (UNP), which is the
biggest and arguably the most expensive of the major US railroads — and
also the one that has a strong position in that sand shipping, and a
secondary position behind Burlington Northern in North Dakota.
The
slightly smaller ones, CSX (CSX), Kansas City Southern (KSU) and Norfolk
Southern (NSC), are still big companies ($10-20+ billion market cap
each), and with the exception of KSU they’re not valued quite as high —
largely because they depend a bit more on different volume drivers (like
coal for CSX, or intermodal and Mexican trade for KSU) and have less
exposure to these growth markets, though everyone seems to be buying
plenty of tank cars.
The other railroads are really talking up their oil transport
capacity in many cases, since that’s what investors want to hear in the
conference calls after they’ve been warned about coal mine shutdowns in
Appalachia … but KSU is a Southern US-Mexico railroad and both CSX and
NSC have routes that are almost entirely east of the Mississippi and
focused largely on the industrial midwest and the East Coast coal mines
and ports. UNP and BNSF have been the big midwest grain carriers in the
past, and are the companies with North Dakota and Western exposure now,
but all of the railways are diversified across major intermodal,
commodities, and manufactured goods (like autos) shipping to some
degree, and they are all constrained to some degree by rights of way and
regional route networks that were put together and designed for flows
of trade 50 or 100 years ago. They’re a lot more efficient and less
flexible than trucks, and a lot less efficient and more flexible than
pipelines.
And frankly, they’re all doing pretty well right now. You can also
add in the two major Canadian railroads, Canadian Pacific (CP) has
gotten a fair amount of attention from investors over the past couple
years as Bill Ackman has built a major position and pushed through some
management changes, which have helped the stock price tremendously, and
Canadian National Railway (CNI) is probably the company that should
benefit close to as much from the Bakken and Canadian oil as Union
Pacific based on their route map (CNI has a central US route down to the
Gulf of Mexico, and also touches both coasts in Canada). The other big
publicly traded North American railroad is Genesee & Wyoming (GWR),
which runs a lot of short lines around the country (and in Australia
and Canada) and just bought competitor RailAmerica last Fall, they have
good exposure to frac sand mines in the Midwest, and to the Marcellus
shale.
The Motley Fool has recommended CNI and GWR in the past, I know,
though their CNI pick was several years ago. Railroads have been pretty
hot for the past year or so and most of the rail stocks are at or near
their highs. So none of these are dirt cheap, but they’re all seeing
business be better than the coal slowdown would lead you to expect, and
they are mostly cyclical companies that move on demand for natural
resources and on rising global trade in general, so folks may also be
piling on as optimism rises for a real economic recovery taking hold.
I’ve been satisfied with getting my exposure to the railroads through
Berkshire Hathaway so far, but there is something compellingly “real”
and delightfully monopolistic about the railroads — there’s always
reason for concern, since the railroads have been awful businesses for
long stretches of time in the past, too, but perhaps the modern day
railroad barons are, well, running a better railroad.
Subscribe to:
Posts (Atom)