by Eric Parnell
How do you stop a man from printing another $1 trillion of
the global reserve currency? This is seemingly an impossible task to
achieve. With inflationary pressures still subdued, the U.S. Federal
Reserve remains compelled to act as aggressively as possible in an
ongoing effort to jump-start the economy and bring down stubbornly high
unemployment. Never mind that the $2.3 trillion already
printed by the Fed since the outbreak of the financial crisis several
years ago has not resulted in a sustainably strong economic recovery to
this point. Perhaps another $1 trillion or more will finally do the
trick. But what are the unintended consequences to these repeated and
extreme actions? And what if anything can finally grab the attention of
the Fed to put a stop to the money printing? Oil may ultimately prove to
be the kryptonite that finally weakens the resolve of Chairman Bernanke
and the Fed's printing press.
Is Inflation Really Under Control?
This
is an important question to consider before going any further. At first
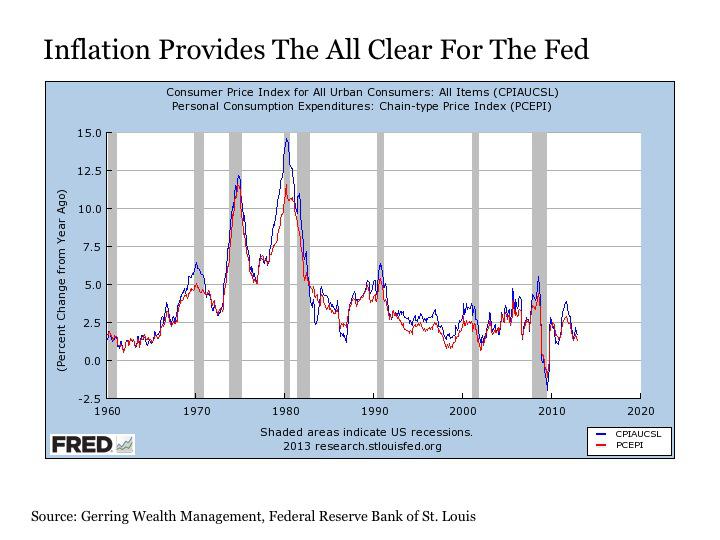
glance, it appears that inflationary pressures are benign. Two
well-known and widely used measures of inflation illustrate this point.
These are the U.S. Consumer Price Index (CPI) reported by the Bureau of Labor Statistics (BLS)
and the Personal Consumption Expenditure (PCE) price index compiled by
the Bureau of Economic Analysis (BEA). Both are derived using
statistical methodologies in an effort to best estimate changes in the
price level of consumer goods and services over time. And an examination
of both of these measures strongly suggests that inflationary pressures
are under control and pricing stability reigns, with the year over year
change in prices for both measures both comfortably between 1% and 2%.
(click to enlarge)
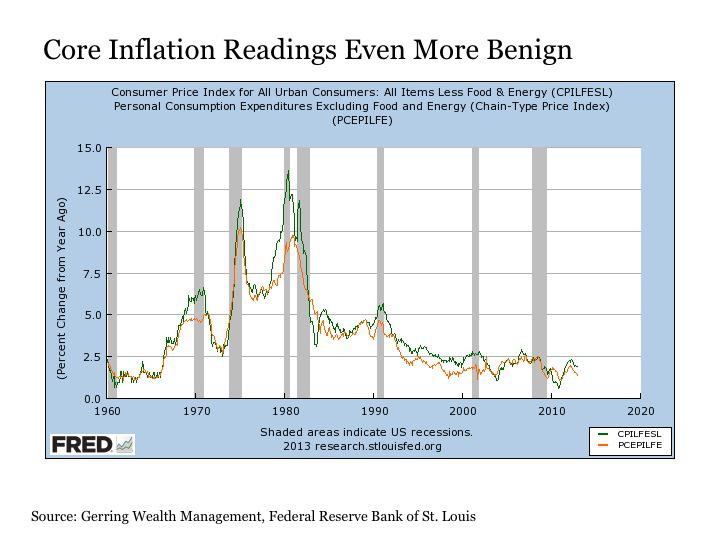
The
core inflation readings that exclude the more volatile food and energy
components reinforce further the idea that inflation is under control.
And these core figures are particularly important for these are the
readings that the Fed relies upon to monitor pricing pressures.
However,
the fact that both the CPI and PCE suggest that inflation is under
control does not necessarily end the discussion. It is important to note
that both readings are based on statistical models that are designed to
estimate changes in prices to the best of their ability. And I have no
doubt that those who have constructed and are maintaining these models
at the BLS and BEA are applying what they have determined to be the most
statistically accurate assessments of pricing. But it is important to
still point out that these are still estimations and not necessarily
statements of fact. For how a model is constructed and the inputs used
can lead to output that can vary widely over time.
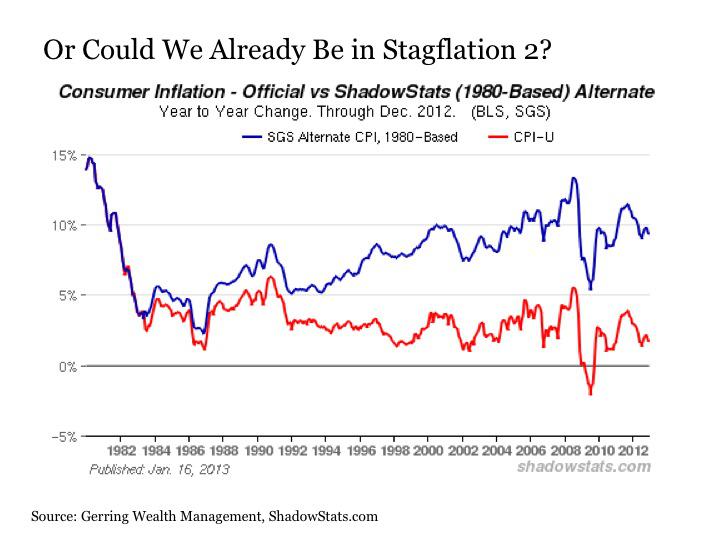
For example, John Williams at ShadowStats.com
provides alternative inflation charts focusing on the CPI. Recognizing
that the BLS changed their estimation methodology in both 1980 and 1990,
he provides a look at how inflation would look today if these previous
models were still in use. Under the pre-1990 model, inflation today
would not be considered under control but instead running fairly hot at
over 5%.

And
under the pre-1980 model, the talk today would likely be about the
return of 1970s style stagflation, not relative pricing stability.
These
examples do not necessarily suggest that we have an inflation problem
today. But what they do suggest is the possibility of an inflation
problem that may already be lurking undetected under the surface. Of
course, any conclusions about prices depend on the measuring methodology
in the end.
And who among the average consumer can really argue with the Fed's conclusions about price stability anyway.
Even if it feels like we may be paying much more for goods and services
than we did in the past, each of us are only one in a vast population
of consumers and are limited in our ability to clearly demonstrate that
we actually have an inflation problem today. It's not as though we have a
billboard that announces the daily price of goods and services in our
economy. This is true, of course, with the exception of one key item
that all Americans need to consume every single day.
What About Oil?
Let
us move forward under the assumption that pricing pressures are under
control, since this is what the Fed is seeing in their models. What then
has the potential to rattle the Fed's cage on the inflation front
whether it shows up in the official statistics or not? This product is
oil. And higher prices related to oil are already arriving at a gas
station near you thanks to the Fed's latest QE3 stimulus program.
The
fact that the Fed largely ignores food and energy prices in focusing on
the core inflation readings instead is another subject for debate in
the statistical modeling process. The justification for excluding these
two items is based on the notion that both categories experience highly
volatile price swings that fail to persist in a sustained price change
over time. But here's the problem. Whereas price changes in these
categories may not have persisted over time in the past, they have
absolutely persisted over the last decade.
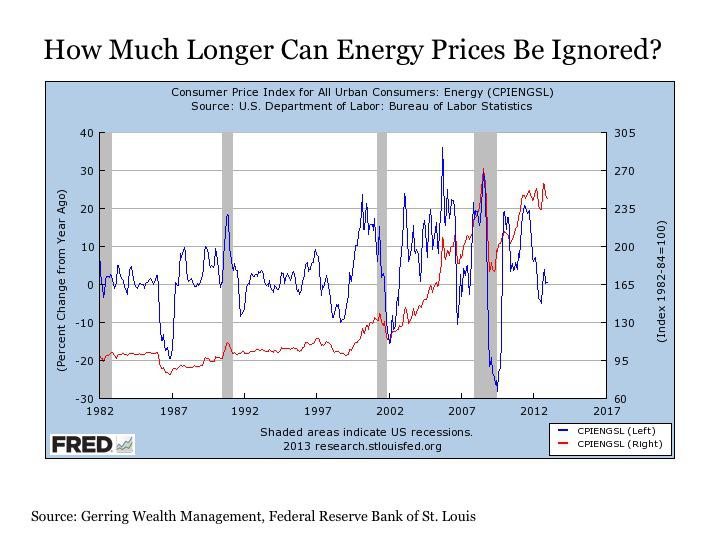
An
examination of energy in particular highlights this point. From the
early 1980s up until the year 2000, energy prices would experience wild
short-term swings (the blue line on the chart above) but underlying
prices would remain relatively stable (the red line on the chart above).
This, of course, began changing dramatically at the start of the new
millennium, as the violent price swings were not neutralizing themselves
out as they had in the past but instead have been accumulating into
sustained price increases at a rate of +7.5% per year on average over
the last decade. Putting this in simpler terms, the price of gasoline
was still consistently below $2 per gallon in the U.S. back in 2005.
Eight years later in 2013, the notion of seeing gasoline below $3 per
gallon seems far-fetched. And the prospects of gas prices rising
sustainably past $4 per gallon or even $5 per gallon in the near-term
are more than realistic.
In short, it is difficult to continue
looking past food and energy prices when assessing inflation, for the
increases in these categories are not only persisting but are also
increasingly serving as a tax on the purchasing power of consumers.
Unfortunately,
the Fed is stoking the fire under energy prices with its latest QE3
stimulus program. It is not just stock prices that float higher day
after day completely drunk on Fed liquidity. It is also energy prices
including the staple commodities of oil and gasoline. And dating back to
the beginning of the financial crisis, when the Fed has engaged in a QE
stimulus program, energy prices including gasoline have floated
steadily higher.
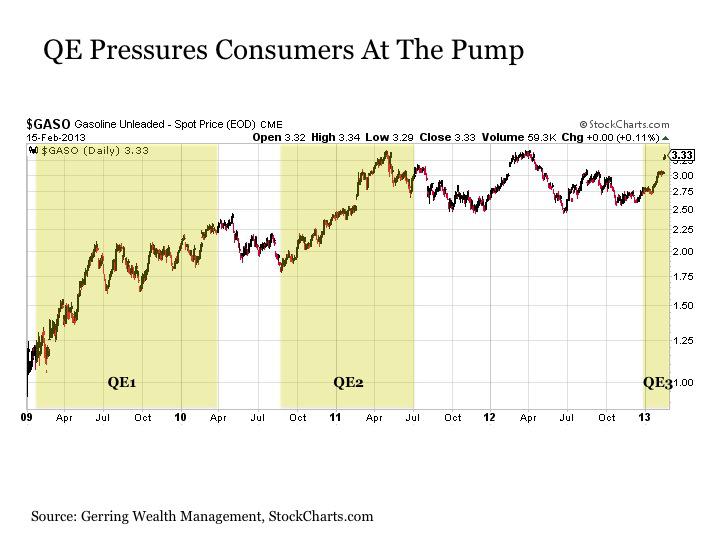
An
important distinction is worth noting about QE and asset prices. It's
not just any QE that gooses the prices of stocks and commodities higher.
Instead, it is specifically U.S. Treasury purchases by the Fed that
causes the market melt ups, for this specific strategy provides the
daily injections of liquidity that float the markets higher almost
daily. This is why the latest QE3 program launched in September 2012 was
falling flat in asset markets until recently, for it was not until
Treasury purchases commenced at the beginning of January 2013 that asset
prices began steadily inflating.
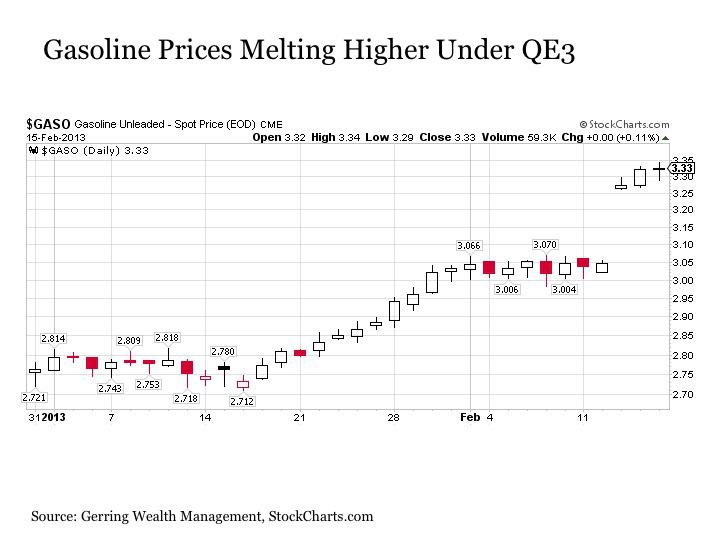
Since
the start of the year, the rise in gasoline prices has been both sharp
and persistent. Heading into 2013, the spot price of unleaded gasoline
was lingering between $2.70 and $2.80 per gallon. But once the forces of
QE finally latched on to gasoline prices starting on January 17, the
subsequent rise has been almost relentless. Over the past month,
unleaded gasoline prices have risen in 18 out of the last 22 trading
days. The cumulative effect has been a +20% rise in the spot price so
far this year.
In short, the Fed's dogged efforts to try and
increase stock prices for the roughly half of Americans that own stocks
today according to a Gallup poll in order to create a wealth effect that
just might marginally increase economic growth at some point down the
road is coming at a cost of effectively taxing all Americans today who
rely on gasoline to drive their cars and petroleum products to heat
their homes. No wonder we have yet to see any sustained benefit to the
economy from QE to date. Perhaps it is even hurting more than helping at
this stage.
The Fed's Pain Threshold For Higher Gas Prices
The
folks at the Fed are smart people. They have to know that QE is
directly juicing not only stock prices but also energy prices including
gasoline. And unlike nearly all other goods and services in our economy,
the price of gasoline is one that is projected on big billboards
throughout the streets of our respective towns each and every day. And
while companies can narrow the width of men's ties, cut down the length
of toilet paper rolls and shrink the size of popsicles in order to hide
price inflation in most other parts of the economy, a gallon of gasoline
is always going to be a gallon of gasoline. Thus, the price at the pump
is the one key data point on inflation where there is absolutely
nowhere to hide. The price of gasoline is announced loudly each and
every day, and it is critical to wonder exactly what the price threshold
will be when consumers begin to riot.
Looking ahead, it is highly
likely that we will see $4 per gallon gasoline perhaps as early as the
spring. And a run at $5 per gallon is certainly possible by the time we
are in the midst of the peak summer driving season. While it is almost a
given that the completely nonsensical, absolute garbage political
rhetoric about greedy oil companies will return to our airwaves if and
when this gasoline price rise occurs, the truth will remain that the
blame for the rise in energy prices will almost entirely rest at the
feet of the Fed. And whether they say so or not, they are smart enough
to know that this is true.
So exactly what gasoline price point
sets off public alarms remains to be seen. But it will become
increasingly difficult for Fed officials to justify to the American
people that we do not have an inflation problem when gas prices at the
pump are screaming higher. And this will be true whether the Fed is
receiving the blame for the price rise from the public or not. Whether
the rising price of gasoline ultimately proves to be Bernanke's
kryptonite for further QE will be a critical theme to watch as we move
into the middle part of the year.
In the meantime, it is
worthwhile to prepare your portfolio for such an outcome. And focusing
on oil and gas stocks that are highly correlated with rising energy
prices is an attractive theme. Representative names include Exxon Mobil (XOM), Chevron (CVX), Occidental Petroleum (OXY) and Apache (APA),
the last of which was absolutely drubbed late last week and is now
oversold on a variety of technical readings. BHP Billiton (BHP) is another attractive offering for a more diversified energy and mining allocation.
No comments:
Post a Comment